 Critical Threat Research : The Iranian Cyber War Intensifies!
Comprehensive Threat Exposure Management Platform
# Cybersecurity Metrics Every CISO Should Report to the Board
After twenty years of leading security teams and presenting to boards at companies like Tripwire and RiskIQ, I can tell you this: the metrics that matter to your SOC team are not the metrics that matter in the boardroom. Boards do not want to hear about firewall rule counts or raw vulnerability totals. They want to understand risk in terms they can act on: financial exposure, operational resilience, and compliance readiness.
The challenge is not a lack of data. Most security organizations are drowning in it. The challenge is selecting the right cybersecurity metrics that translate technical performance into business outcomes, and presenting them in a way that drives investment decisions rather than glazing eyes.
This guide covers the 15 cybersecurity metrics and KPIs that belong in every board presentation, organized by what boards actually care about. I will also cover three common metrics that create false confidence, and share practical guidance on how to present technical data to non-technical directors.
> In short: The most effective cybersecurity metrics for the board focus on risk reduction, operational efficiency, and resilience, not raw alert counts or tool output. CISOs should track 8-12 stable KPIs and present them with trend data, targets, and business context.
>
> – Report MTTR, MTTD, and vulnerability exposure windows to show risk reduction over time
> – Track patch compliance, SLA adherence, and false positive rates for operational efficiency
> – Monitor attack surface coverage and security control effectiveness for resilience
> – Present compliance posture and regulatory reporting readiness for governance
> – Avoid vanity metrics like raw vulnerability counts and “attacks blocked” totals
Board oversight of cybersecurity has fundamentally changed. The SEC now requires public companies to describe their board’s oversight of cyber risk and governance processes. CIRCIA reporting requirements reinforce accountability for critical infrastructure entities. In 2026, boards are not asking if you have a security program. They are asking whether it is working.
IDC research confirms that cyber risk has become a top board-level concern globally. Board members are no longer satisfied with technical metrics alone. They want to understand how cyber threats could affect organizational resilience, regulatory standing, and overall business continuity.
This means CISOs need to shift from reporting program performance indicators to reporting risk and compliance management outcomes. The difference is significant: program metrics tell you what you did, while risk metrics tell you where you stand.
Get a unified view of your cyber risk posture with Uni5 Xposure.
These cybersecurity metrics answer the board’s most fundamental question: Is our risk exposure going down?
The vulnerability exposure window measures the average time between when a vulnerability is disclosed and when your organization remediates it. This is arguably the most important risk metric because it directly quantifies how long your organization sits exposed to known threats.
What to report: Average exposure window for critical and high-severity vulnerabilities, segmented by asset criticality. Include the trend line over the past four quarters.
Board context: A shrinking exposure window means your team is closing gaps faster than attackers can exploit them. Target benchmarks vary by industry, but CISA’s Binding Operational Directive 22-01 requires remediation of known exploited vulnerabilities within 14 days.
MTTR measures how quickly your team resolves confirmed security issues from detection through fix verification. It is one of the most widely used incident response metrics and a direct reflection of your security operation’s maturity.
What to report: MTTR for critical, high, and medium vulnerabilities separately. Always show the trend. A single MTTR number is meaningless without context.
Board context: Boards understand time-to-fix intuitively. If your MTTR for critical vulnerabilities is dropping from 21 days to 7 days, that is a story of measurable improvement. Platforms that automate vulnerability and threat prioritization dramatically reduce MTTR by focusing teams on the threats that matter most.
MTTD measures how quickly your organization identifies a potential security threat after it enters your environment. A low MTTD means threats spend less time hiding in your network, which directly reduces the blast radius of any incident.
What to report: MTTD trend over four quarters, with a breakdown by detection source (automated tooling vs. manual investigation vs. third-party notification).
Board context: According to industry benchmarks, the average dwell time for attacks detected internally is significantly lower than for those discovered by external parties. Investing in detection capabilities pays off in reduced breach severity.
An aggregated risk score provides a single number that reflects your organization’s overall cyber risk posture. This should combine vulnerability severity, asset criticality, threat intelligence context, and compensating control effectiveness.
What to report: A top-five material risk scenario view with movement over time and the next action item for each. Show what moved up, what moved down, and what stayed stuck.
Board context: This is the metric that turns cybersecurity into business tradeoffs. When the board can see that two of five top risks improved while one escalated, they can make informed decisions about resource allocation. The Uni5 Xposure platform computes risk scores using its Unictor engine, which enriches vulnerability data with real-world threat intelligence and asset context to deliver actionable prioritization.
These cybersecurity KPIs and cyber security kpi examples demonstrate that your security program runs efficiently and scales with the threat landscape. Operational efficiency is where SOC metrics and information security metrics overlap with board-level reporting.
Patch compliance measures the percentage of systems that are up to date with required security patches within your defined SLA windows. This is a foundational vulnerability management metric that boards can easily understand.
What to report: Compliance rate by asset tier (crown jewels vs. standard infrastructure), with the delta from last quarter. Include the number of exceptions and their risk acceptance status.
Board context: A 95% patch compliance rate sounds good until the 5% that is unpatched includes your revenue-generating production systems. Always segment by business criticality.
SLA adherence tracks whether vulnerabilities are being remediated within the timeframes your organization has committed to, typically tiered by severity.
What to report: Percentage of critical, high, and medium vulnerabilities remediated within SLA. Show both current quarter and trend.
Board context: This metric demonstrates operational discipline. Consistently meeting SLAs proves your team has the right processes and tools to keep pace with the threat landscape. Missing SLAs consistently signals a resource or prioritization problem that may need board-level intervention.
The false positive rate measures what percentage of alerts turn out to be non-issues. A high false positive rate wastes analyst time and contributes to alert fatigue, which can cause real threats to slip through.
What to report: False positive rate by detection source and severity tier. Show the trend and any correlation with new tool deployments.
Board context: This is an efficiency metric. If 40% of your critical alerts are false positives, your team is spending nearly half its time chasing ghosts. Reducing false positives through better threat intelligence enrichment directly translates to faster response on real threats.
Tool coverage measures what percentage of your environment is actively monitored and protected by your security stack. Utilization measures whether you are actually using the capabilities you are paying for.
What to report: Percentage of assets covered by vulnerability scanning, endpoint protection, and monitoring. Include a utilization score for major security investments.
Board context: Boards approve security budgets. They want to know those investments are being fully utilized. Reporting that only 60% of your endpoint protection licenses are deployed is actionable intelligence for the board.
These cybersecurity metrics tell the board how visible and well-managed your organization’s digital footprint is.
Attack surface coverage answers a critical question: how much of your digital environment is actually being monitored for threats? This includes known assets, cloud workloads, containers, APIs, and shadow IT.
What to report: Percentage of total assets under active security monitoring, with a breakdown of newly discovered vs. known assets. Highlight any gaps in coverage.
Board context: You cannot protect what you cannot see. Comprehensive attack surface management ensures no part of your environment is invisible to your security program. A growing gap between total assets and monitored assets is a red flag that requires immediate attention.
Critical asset exposure focuses specifically on the security posture of your organization’s most valuable assets, the systems that run revenue, hold sensitive data, or support mission-critical operations.
What to report: Number of unresolved critical and high vulnerabilities on crown jewel assets, with trend. Include the percentage of critical assets that have undergone recent adversarial exposure validation through breach and attack simulation.
Board context: This is where cybersecurity connects directly to business continuity. Board members care deeply about the systems that keep the business running. Showing that 100% of critical assets have been validated through BAS testing demonstrates a mature, proactive security posture.
These information security metrics address regulatory requirements and demonstrate due diligence to auditors, regulators, and insurers.
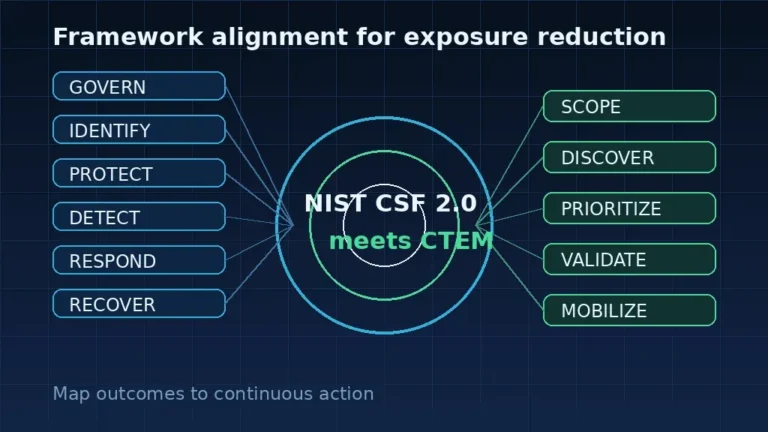
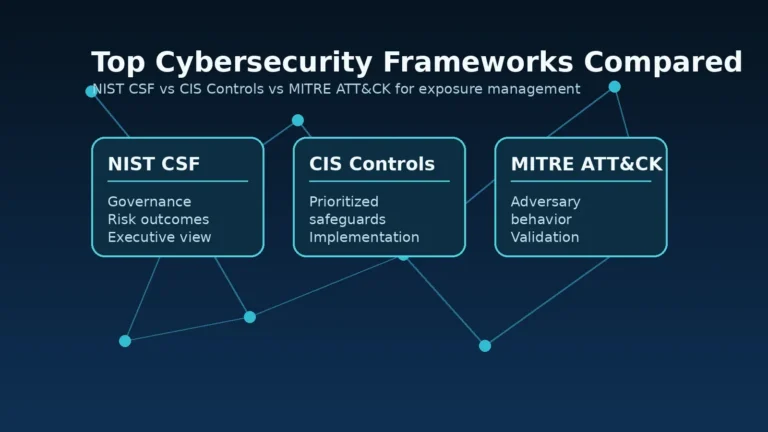
Compliance posture quantifies your organization’s alignment with applicable frameworks such as NIST CSF 2.0, ISO 27001, SOC 2, PCI DSS, HIPAA, or industry-specific regulations.
What to report: Compliance score by framework, with gap closures since last quarter. Include the timeline for resolving remaining gaps and any audit outcomes.
Board context: Regulatory non-compliance carries direct financial and legal consequences. Boards need visibility into compliance status to fulfill their governance obligations and manage liability.
This metric measures your organization’s ability to meet regulatory reporting deadlines, including the time required to assess materiality, classify incidents, and prepare disclosures.
What to report: Average time to produce a reportable incident assessment. Test this metric through tabletop exercises, not just actual incidents.
Board context: Under SEC rules, public companies must report material cybersecurity incidents within four business days. The board needs confidence that the organization can meet this timeline consistently.
These cyber resilience metrics demonstrate that your organization can withstand and recover from attacks.
MTTC measures how quickly your team isolates a confirmed threat to prevent further spread. This is distinct from MTTR, which covers full remediation.
What to report: MTTC for different incident types (ransomware, data exfiltration, credential compromise). Include containment success rate, meaning the percentage of incidents contained before lateral movement.
Board context: Containment speed directly determines business impact. A ransomware incident contained in two hours has a fundamentally different financial consequence than one that spreads for two days. Board members understand this tradeoff intuitively.
Security control effectiveness measures whether your defensive tools and processes actually stop attacks, validated through breach and attack simulation rather than assumed through deployment.
What to report: Percentage of simulated attack techniques blocked by existing controls, with improvement trend. Highlight the top control gaps identified through BAS testing.
Board context: Having security controls in place is one thing. Knowing they work under pressure is another. BAS testing provides concrete evidence of your security efficacy, turning assumptions into verified performance data. Platforms like Uni5 Xposure integrate adversarial exposure validation directly into the exposure management workflow.
Incident recovery time measures how long it takes to fully restore critical business operations after a security incident. This goes beyond containment to include system restoration, data recovery, and business process resumption.
What to report: Recovery time objectives (RTO) vs. actual recovery times for tabletop exercises and real incidents. Include the percentage of critical systems with tested backup and recovery procedures.
Board context: In 2026, boards and regulators judge organizations by how fast they restore operations, not just whether they were breached. Recovery time is a business promise, not a technical detail.
See how Uni5 Xposure automates cybersecurity reporting for executive stakeholders.
Not all cybersecurity metrics belong in a board presentation. Some create a false sense of security or drive the wrong decisions.
Telling the board you have 47,000 open vulnerabilities sounds alarming, but the number alone is useless. It punishes organizations with better visibility (more scanners find more vulnerabilities) and ignores business context. Replace raw counts with risk-weighted exposure that accounts for asset criticality and exploit availability.
Reporting that your firewall blocked 2 million attacks last month sounds impressive but communicates nothing about risk. High block counts are expected. What matters is whether any attacks got through, and what happened when they did.
A 100% score on a compliance audit does not mean you are secure. Compliance measures adherence to a framework at a point in time. It does not measure whether your controls actually stop real-world attacks. Always pair compliance metrics with control effectiveness validation.
Having spent years in the boardroom at companies like Tripwire and RiskIQ, I have learned that presentation matters as much as content. Here is what works:
Frame every metric in terms of business impact. Instead of saying “MTTR decreased by 40%,” say “We now resolve critical security issues 40% faster, reducing our average exposure window from three weeks to nine days.”
A single number lacks context. Show four quarters of data minimum so the board can see direction. Improving trends build confidence; declining trends trigger productive discussion about resources.
Your board deck should have one executive summary slide with five to seven key metrics, supported by appendix slides with detail. If a board member needs to flip through 15 slides of charts to understand your security posture, you have already lost their attention.
Every metric needs a target (where you are heading) and a threshold (when to escalate). When a metric crosses a threshold, the board knows it requires action. This prevents the “red dashboard” problem where every metric stays yellow and no one takes action.
For each metric, answer three questions: Where are we? Where should we be? What do we need to get there? This turns a reporting exercise into a strategic conversation.
Book a demo to see how Uni5 Xposure simplifies board-level cybersecurity reporting.
How many cybersecurity metrics should a CISO report to the board?
Keep the core dashboard to eight to twelve metrics. Five to seven should be stable, outcome-focused KPIs that the board sees every quarter. You can rotate two to three supporting metrics based on current priorities. Consistency makes trends meaningful, so avoid changing your core metrics every quarter.
How often should CISOs present cybersecurity metrics to the board?
Monthly at the committee level and quarterly at the full board level. Supplement with real-time alerts for material incidents. Ad-hoc updates undermine governance discipline. Establish a regular cadence and stick to it.
What is the difference between cybersecurity metrics and KPIs?
A metric is any measurable data point (e.g., number of vulnerabilities scanned). A KPI is a metric tied to a specific performance goal (e.g., 95% of critical vulnerabilities remediated within 14 days). Board presentations should focus on KPIs because they include targets and accountability.
How should a CISO align cybersecurity metrics with business objectives?
Start by understanding what the board cares about: revenue protection, regulatory compliance, customer trust, and operational continuity. Then map each cybersecurity metric to one of these business outcomes. For example, MTTR connects to operational continuity, while compliance posture connects to regulatory risk. This framing transforms cybersecurity from a cost center into a business enabler.
What tools help automate cybersecurity board reporting?
Look for a platform that consolidates data from your existing security stack into unified dashboards with executive-level views. The platform should track KPIs like MTTR, risk scores, and compliance posture automatically, eliminating manual report compilation. Real-time reporting reduces lag and ensures the board always sees current data.